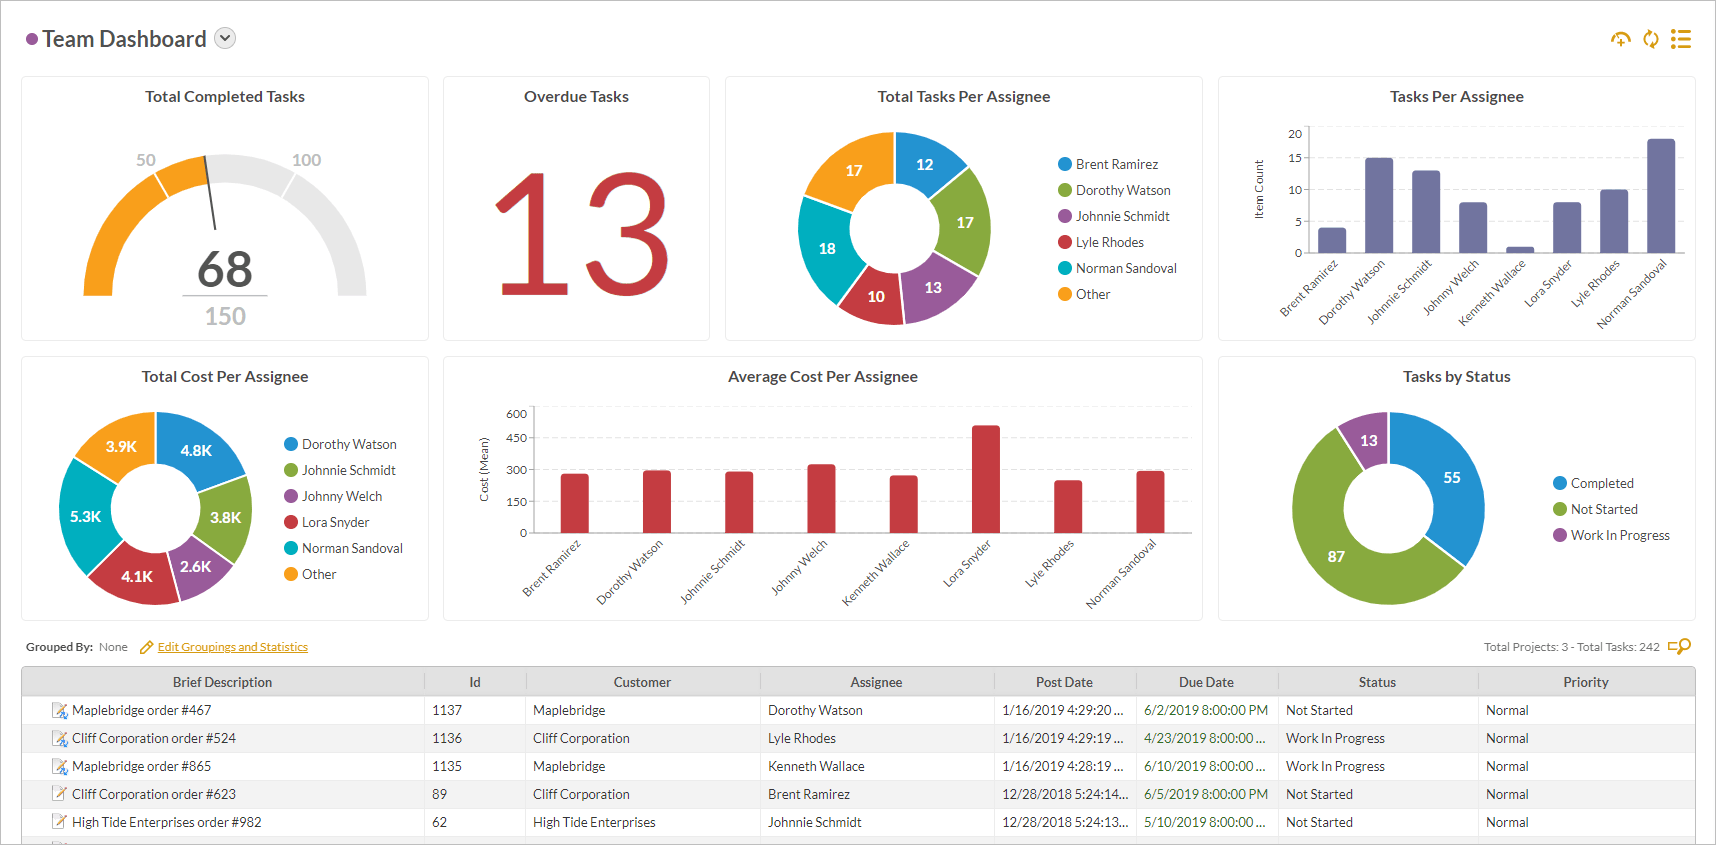
HighGear 8.3 brings your performance data to life with colorful new Dashboard capabilities. These simple yet powerful visualizations allow users to easily display real-time gauges, column charts, and pie charts to quickly view key performance indicators, monitor important metrics, and analyze business trends. All dashboards update in real time as work is completed to provide at-a-glance visibility into the status of operations across teams, projects, and departments. Dashboards are designed with ease-of-use in mind to help end users make sure their work is on track, allow managers to verify tasks are completed, and provide executives with a high-level overview into day-to-day business operations.
- Self-hosted customers with an active maintenance agreement can immediately download the self-installing upgrade from the HighGear customer portal.
- SaaS customers will be automatically upgraded to version 8.3 at 10pm on Saturday, July 6th. If you have any questions please contact support@HighGear.com.
- For support, please contact support@HighGear.com.
- For additional licenses or services, please contact sales@HighGear.com.
Dashboards
Multiple data visualizations: 8.3 introduces four new data visualizations: Analog Gauges, Digital Gauges, Column Charts, and Pie Charts. More visualization options will be coming in future releases! Gauges: With Gauges, users can easily highlight key numbers and performance indicators. Gauges can be configured to display a target value and be color coded so that users can easily track progress at a glance. Easy Configuration: Gauges and charts are easy to set up and modify. Users can choose the data for their gauges and charts using the powerful and familiar search tools and inspect the results in the Data Preview section to ensure that their criteria are correct. A preview of gauges and charts is visible while changes are made so the user receives immediate feedback as they set up their new visualization. 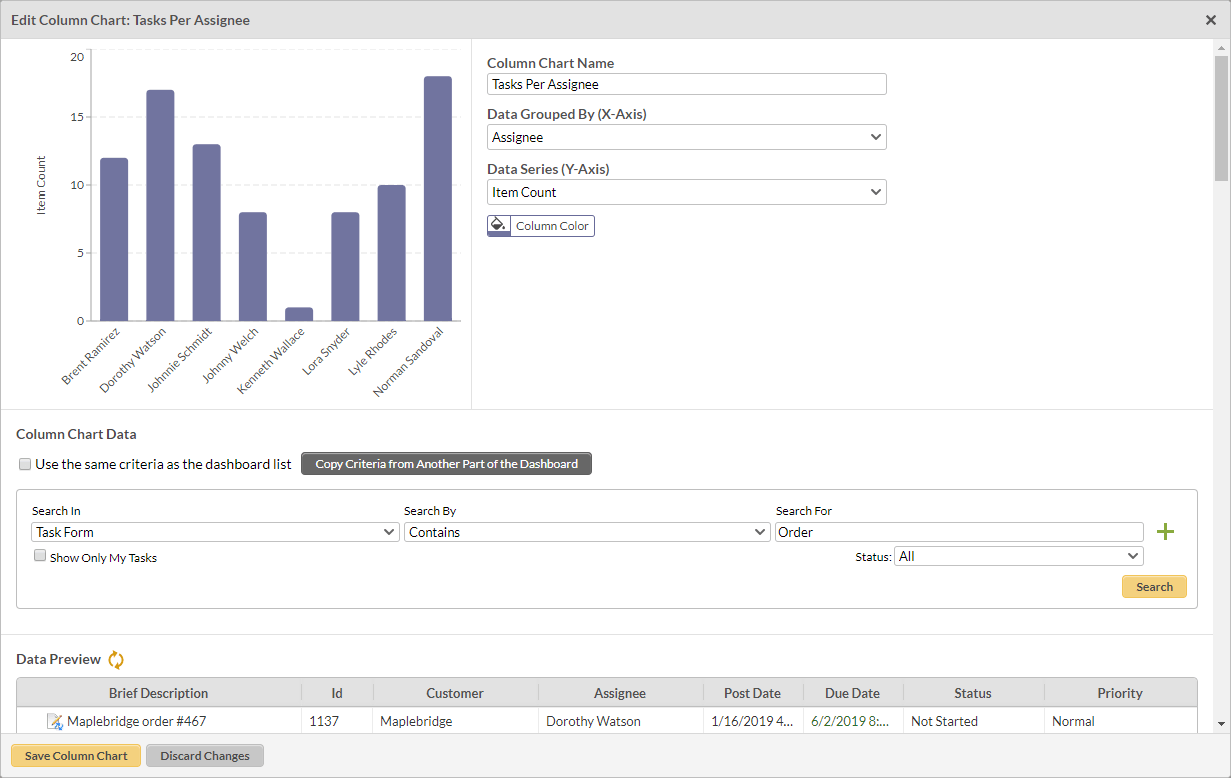 Customized Layout: Gauges and charts can be quickly positioned and resized using an intuitive drag-and-drop interface enabling users to achieve the exact layout they desire for their dashboard. Real-Time Updates: Gauges and charts are updated as tasks and projects are saved so users immediately see the impact of their changes. Shared Dashboards: Dashboards can also be published to team members using permission groups so that managers and administrators can distribute common dashboards to their teams.
Other Features and Enhancements
Improved Numeric Formatting: Values in numeric textboxes are now formatted as the user is typing when the “Enable Number Formatting” setting is selected. In addition, the formatting is now shown in the audit trail for numeric textboxes.
Upcoming System Requirement Changes
HighGear 8.3 will be the last version to support Microsoft SQL Server 2008 and 2008 R2. Microsoft is dropping support for Windows Server 2008 R2 on January 14, 2020. Windows Server 2008 R2 will not be supported by any HighGear versions released after that date.