HighGear 8.4 builds on the compelling Dashboards feature with tools that unlock even more powerful visualizations and data analysis tools for business analysts and end users alike. Column charts now support Multiple Data Series, which enable visualizations of year-over-year comparisons and other metrics. In addition, all charts and gauges in the system now allow the user to drill in to a specific column or slice to see the tasks and projects that are being summarized. These new features make it easier than ever for business analysts, managers, and executives to gain insight into high-level business operations while still being able to quickly drill into the details when needed.
- Self-hosted customers with an active maintenance agreement can immediately download the self-installing upgrade from the HighGear customer portal.
- SaaS customers will be automatically upgraded to version 8.4 at 10pm on Saturday, November 9th. If you have any questions please contact support@HighGear.com.
- For support, please contact support@HighGear.com.
- For additional licenses or services, please contact sales@HighGear.com.
Multiple Data Series for Column Charts
In 8.4 column charts can now be configured to show multiple series to enable comparisons between related metrics for the same set of categories. For example, users can now create charts to compare metrics for multiple regions over time, look at last year’s performance versus this year’s performance, or compare the workloads of different team members.
Easy to Configure and Customize
New series can be easily added to charts from a chart’s configuration page. Users can choose the color for the new series and give it a label. They can also put a series on a secondary axis if the data ranges are different.
Dashboard Drill In
In HighGear 8.4 users can now drill in to the data that makes up different parts of their dashboards by clicking on gauges, columns, and pie slices. For example, a user can click on a slice of a pie chart and see the tasks and projects represented in that slice.
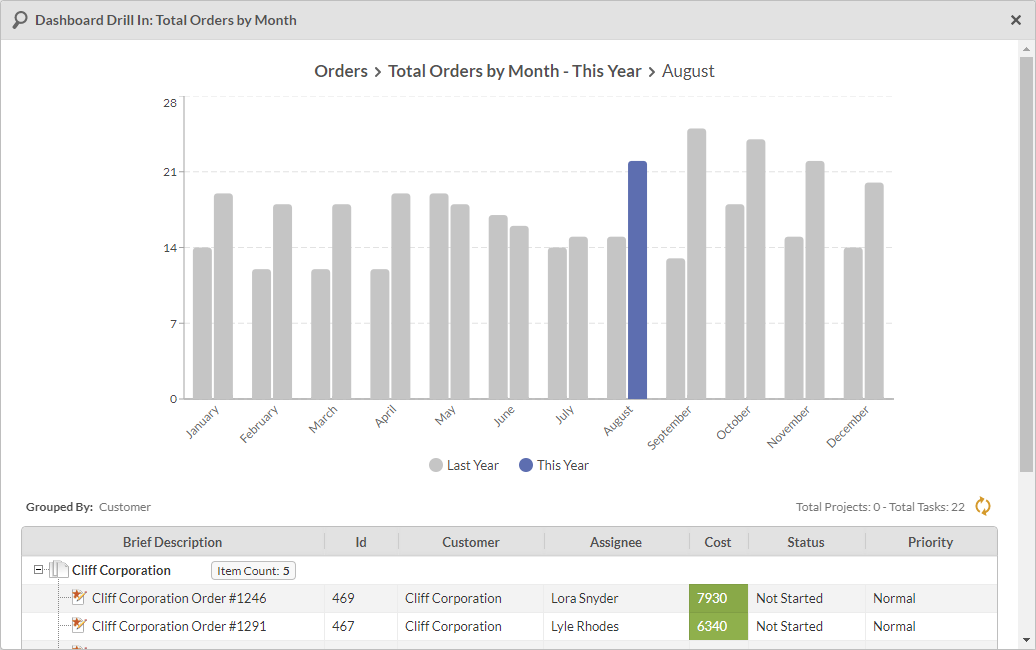
Designed for Analysis and for Work
The drill in list results are a fully functional list so users can open tasks to make changes, create new tasks, or do a batch edit. For example, a manager might use a chart to analyze the distribution of work for a team and use the drill in feature to reassign work to an underutilized team member.
Customizable Drill In Results
8.4 also enables dashboard designers to customize the grouping, statistics, and conditional formatting that is displayed when drilling into a chart or graph. This can be done from the Data Preview section of the configuration interface.
Performance and Scalability Improvements
In addition to the new features, this release includes the following performance and scalability improvements:
- Large, long-running workflows run faster and with less impact on other areas of the system.
- Tasks and projects are created from recurring templates more quickly.
- Calendar page load time improvements.
Updated System Requirements
HighGear 8.4 no longer supports Microsoft SQL Server 2008 and 2008 R2.
Upcoming System Requirement Changes
The next version of HighGear will require Microsoft .NET 4.8.
Microsoft is dropping support for Windows Server 2008 R2 on January 14, 2020. Windows Server 2008 R2 will not be supported by any HighGear versions released after that date.